 Inngest
Show the feature in a chart
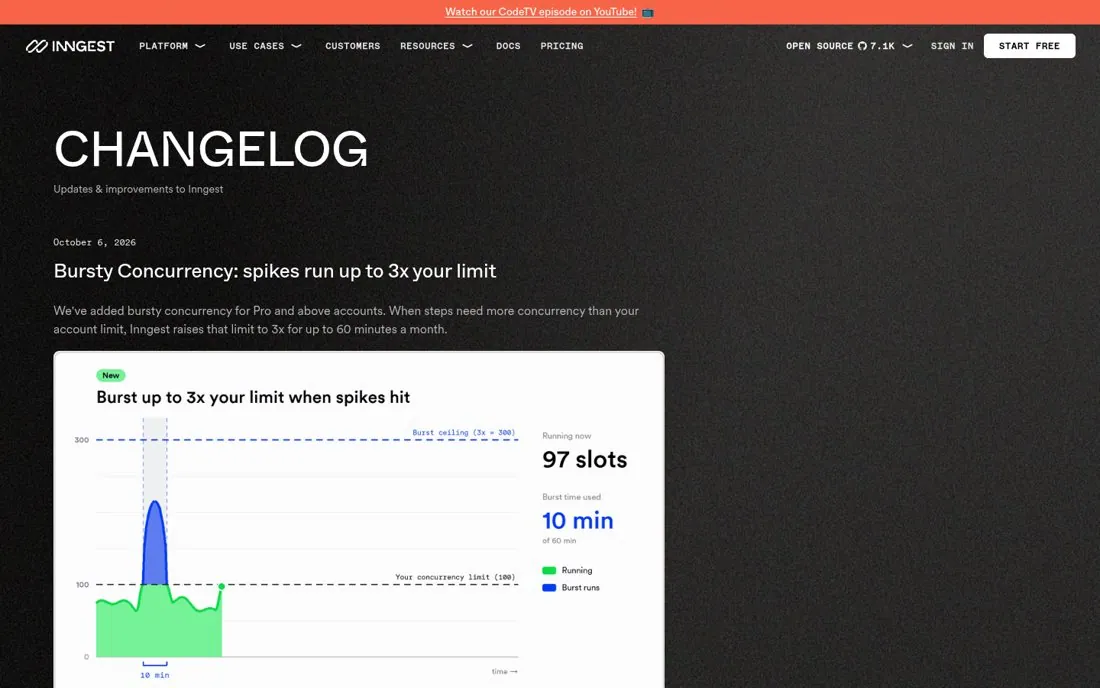
Inngest's changelog opens with Bursty Concurrency: spikes run up to 3x your limit. The entry shows a chart of a traffic spike above the concurrency limit, then explains the feature in short labeled lines like Size, Counting, Refill, Notifications and Billing.
Updated · By Blake Emal
A chart shows what the feature does in one look, and labeled lines answer the follow up questions before support gets them. To copy it, add a chart or visual to big updates. Then explain the feature in short labeled lines.
- Add a chart or visual to big updates
- Explain the feature in short labeled lines
- Answer how billing works in the entry
Live page captured Oct 24, 2026 · Inngest