Today’s Marketing
 PostHog
Turn product data into a chart buyers find themselves in
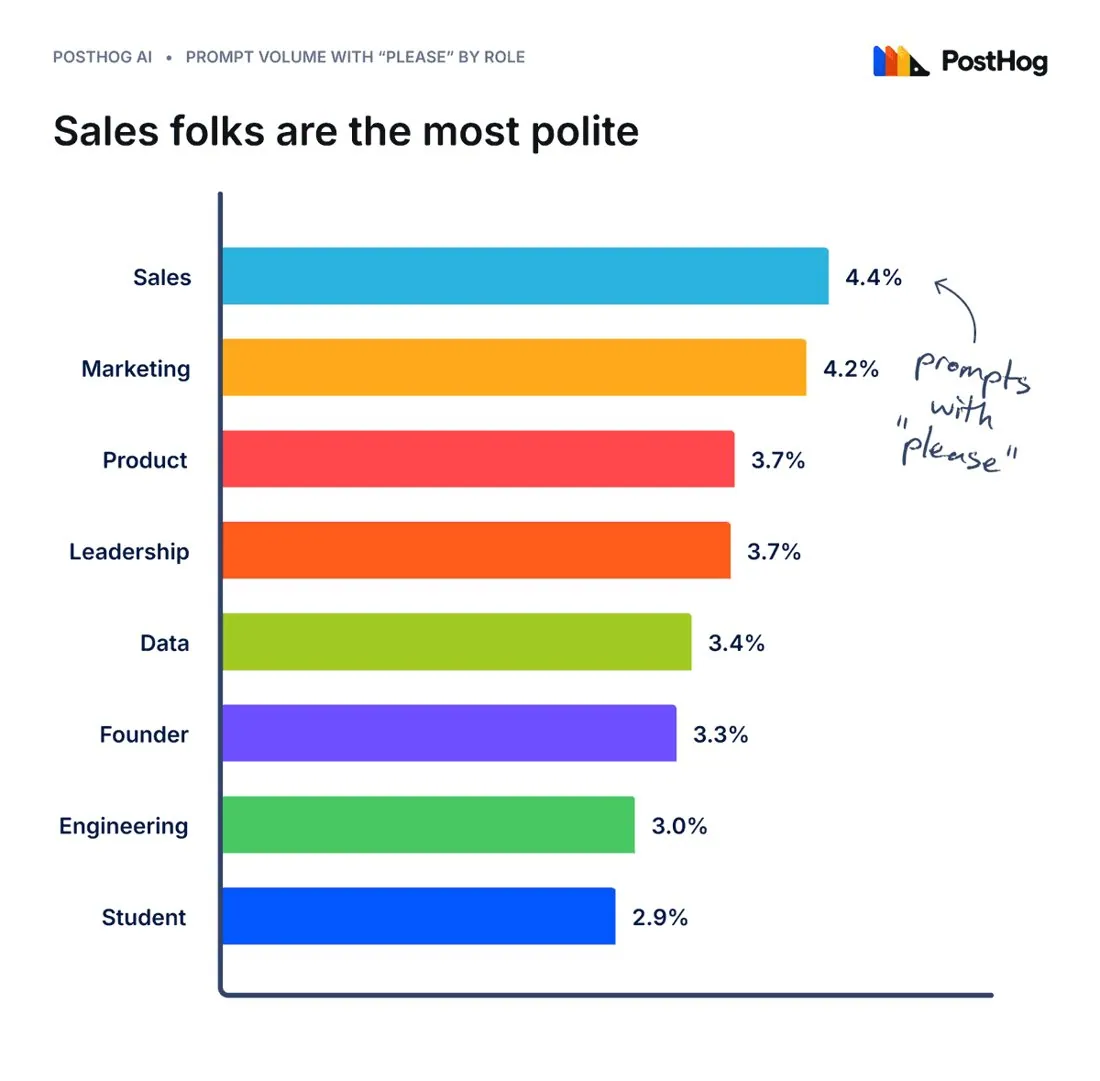
PostHog posted a chart on Nov 6, 2026 of how often each job role says please to PostHog AI. Sales tops it at 4.4% of prompts and students sit last at 2.9%, as PostHog reports. The research article behind it is dated Oct 30, 2026.
Updated · By Blake Emal
PostHog posted a chart on Nov 6, 2026 titled Sales folks are the most polite, showing the share of prompts with please to PostHog AI by role: Sales 4.4%, Marketing 4.2%, down to Student 2.9%. The numbers are PostHog's own reported findings.
The thread links its research article, dated Oct 30, 2026. A light human question about real product use, split by the job titles its buyers hold, lets every reader find their own role on the chart and share it.
- Ask a human question of your aggregated product data and split it by a role your buyers recognize
- Label exactly what the number measures, like share of prompts, and link your method
- Post one readable chart per finding and leave out any individual customer data
Posted Nov 6, 2026 · PostHog · PostHog's research article (Oct 30, 2026)
Bring Blake your homepage or launch plan and leave with the new version written. Book a call
Social Post ExamplesBest Marketing Examples of November 2026How to turn a viral brand moment into a campaign